




What is Google Analytics? Everything you need to know
Google Analytics has become a key tool for analyzing user behavior in digital environments and understanding how people interact with websites and applications. In the current context of Spain’s digital economy, data measurement is no longer optional but a common practice among companies of different sizes and across different sectors. According to the Survey on the use of ICT and ecommerce in companies (2025) by the Spanish National Statistics Institute, more than 26% of Spanish companies with more than ten employees make sales through ecommerce, highlighting the need for reliable analytics systems that comply with current regulations.
This environment has driven the use of Google Analytics 4, a version designed to adapt to changes in privacy, devices and digital consumer behavior. Knowledge of this tool is part of the training of professionals working in digital analytics and marketing, areas commonly covered in programs such as the Bachelor’s Degree in Marketing and Digital Communication, where data based decision making plays a central role.
Main features of Google Analytics
The main function of Google Analytics is to collect, process and visualize digital behavior data to support informed decision making. Through GA4, the tool makes it possible to analyze how users reach a website, which actions they take and which factors influence the results achieved.
One of its most relevant features is event based measurement, which records each relevant interaction individually. This approach provides a more detailed view of the user journey and is particularly useful for assessing the performance of content, campaigns and digital channels.
Another key feature is audience creation, which makes it possible to group users according to criteria such as behavior, source or level of interaction. This type of segmentation is common in results focused marketing strategies, such as those covered in advanced management programs including the Master in Marketing Management, where data analysis supports strategic planning.
Key Google Analytics terms and metrics
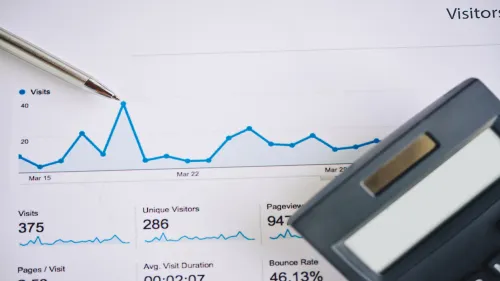
Understanding Google Analytics metrics correctly is essential for interpreting data accurately. GA4 introduces updated terminology that focuses on the quality of interaction rather than simply the volume of visits.
Below are the main Google Analytics concepts and metrics that every professional should know.
1. Users and sessions
- Users: people who visit a website. Google Analytics identifies users anonymously and makes it possible to distinguish between new and returning users.
- New users: people who access the website for the first time during the period analyzed.
- Sessions: a group of interactions that a user carries out on a website within a specific period of time. By default, 30 minutes of inactivity ends a session.
2. Page views and pages per session
- Page views: the total number of pages loaded, including repeated views.
- Pages per session: the average number of pages a user visits during a session.
3. Average session duration
Average session duration indicates the average amount of time users spend on the website. Although it does not always reflect the quality of the experience, it is a useful indicator for assessing the level of interaction with content.
4. Bounce rate
Bounce rate represents the percentage of sessions in which a user leaves the website after visiting a single page without carrying out any additional interaction.
A high bounce rate is not always negative, but it may indicate:
- Content that is not sufficiently relevant
- Usability issues
- Expectations that are not met after arriving from the traffic source
5. Traffic channels and sources
- Google Analytics classifies where users come from according to different channels:
- Organic Search: traffic from search engines (SEO).
- Paid Search: traffic from paid advertising campaigns.
- Direct: users who access the website by typing the URL or using bookmarks.
- Referral: traffic from other websites.
- Social: traffic from social media.
- Email: visits from email campaigns.
Analyzing these channels makes it possible to evaluate which marketing activities are performing best.
6. Conversions and goals
Goals: actions considered valuable to the business, such as completing a form, making a purchase or downloading a document.
- Conversions: the number of times these goals are completed.
- Conversion rate: the percentage of sessions that result in a conversion.
These metrics are essential for measuring the real impact of traffic on business results.
7. Events
Events make it possible to measure specific user interactions that do not necessarily involve loading a new page, such as:
- Button clicks
- Video plays
- File downloads
- Form interactions
These events are essential for analyzing user behavior in greater detail.
These metrics are particularly relevant in digital marketing projects, an area commonly covered in the Master in Digital Marketing & Growth Hacking, where continuous optimization is based on data analysis.
How to set up Google Analytics step by step
Proper Google Analytics configuration determines the quality and usefulness of the data collected. The process begins by creating an account and a property in Google Analytics 4, which is then connected to a web or app data stream.
Once the property has been created, a measurement ID is generated and must be integrated into the website. The most common option is to use Google Tag Manager, as it allows tags and events to be managed flexibly without directly modifying the code.
During this process, it is advisable to enable enhanced measurement, which automatically records interactions such as scrolls, outbound clicks and internal searches. This configuration provides a more complete initial view of user behavior.
In addition, GA4 includes specific options for privacy management, aligned with the General Data Protection Regulation, established in Regulation (EU) 2016/679 of the European Parliament and of the Council.
These options make it possible to adjust data collection according to user consent and the European legal framework.
Google Analytics reports and dashboards
Google Analytics reports make it possible to transform data into useful information for decision making. GA4 organizes reports into areas focused on acquisition, engagement, monetization and retention.
- Acquisition reports show how users reach the website, distinguishing between organic traffic, paid campaigns, social media and direct visits. This analysis is essential for evaluating SEO strategies and SEM campaigns.
- Engagement reports analyze behavior within the website, identifying the most visited pages, time spent and key events. This information is particularly useful for improving user experience and content performance.
GA4 also makes it possible to create custom dashboards adapted to specific objectives. This functionality is common in projects involving an SEO consultant, who is responsible for translating data into practical recommendations.
Integration with other digital marketing tools
Integrating Google Analytics with other tools increases the value of digital analysis and provides a more complete view of online performance.
Connecting it with Search Console makes it possible to analyze search queries alongside user behavior, which is essential for content optimization supported by different SEO tools.
In addition, integration with advertising platforms makes it possible to evaluate campaign returns and adjust budgets. Exporting data to BigQuery also enables advanced analysis of large volumes of information, a practice that is increasingly common among technical and analytical professionals.
Google Analytics 4 represents an evolution in the way digital behavior is measured and analyzed, adapting to an environment shaped by privacy, artificial intelligence and the use of multiple devices. Understanding its features, metrics and reports makes it possible to optimize websites, campaigns and digital strategies from a data based perspective.
Related Programs

Master in Digital Marketing & Growth Hacking
Marketing, Communication & SalesThe EAE Barcelona Master in Digital Marketing & Growth Hacking is an innovative and powerful...
- Multiples Modalities

Master in Corporate Communication & Brand Management
Marketing, Communication & SalesTransform brands through communication and a cross-functional management culture
- October 2026
